COVID-19 case analysis in India
COVID-19 or coronavirus is the infectious disease caused by the most recently discovered coronavirus. It was first known in December,2019 at Wuhan,China, which then soon turned into a global pandemic as declared by the World Health Organization(WHO) on 11 March,2020.
There are many ways that the virus is currently spreading, but it started out to be spread primarily from person to person through small droplets from the nose or mouth, which are expelled when a person sneezes,coughs or speaks. People can catch the virus if they breathe in these droplets. The most common symptoms of this virus have said to be evolving ever since the pandemic first came into effect, where currently people have been diagnosed with the virus without the initial symptoms like cough,fever,etc.
Unfortunately, one of the top 5 countries that were affected by the pandemic was India, after United States and Brazil recently with a whooping count of 122437975.This is a relatively high number of people who were confirmed with the covid virus tests, as the population of India is 1210568111, which brings to the conclusion that 10.1140922% of population in India have been tested Positive with the virus.
The DT figure 1 above shows the different states and territories within the country, the number of cases, deaths and recovered cases within each state, this table also shows the total population of each state/territory and the number of hospitals and the number of beds that are available per person within a state/territory for the population, this can be used to predict the efficiency of hospitals within a state/territory to accommodate the people infected. It also shows the difference in population within each state as urban and rural populations and corresponding number of beds within the state. This is a pdf downloadable datatable, all the other data numbers can be viewed by scrolling either right<–>left or up<–>down. You can also highlight the line by just clicking on the row.
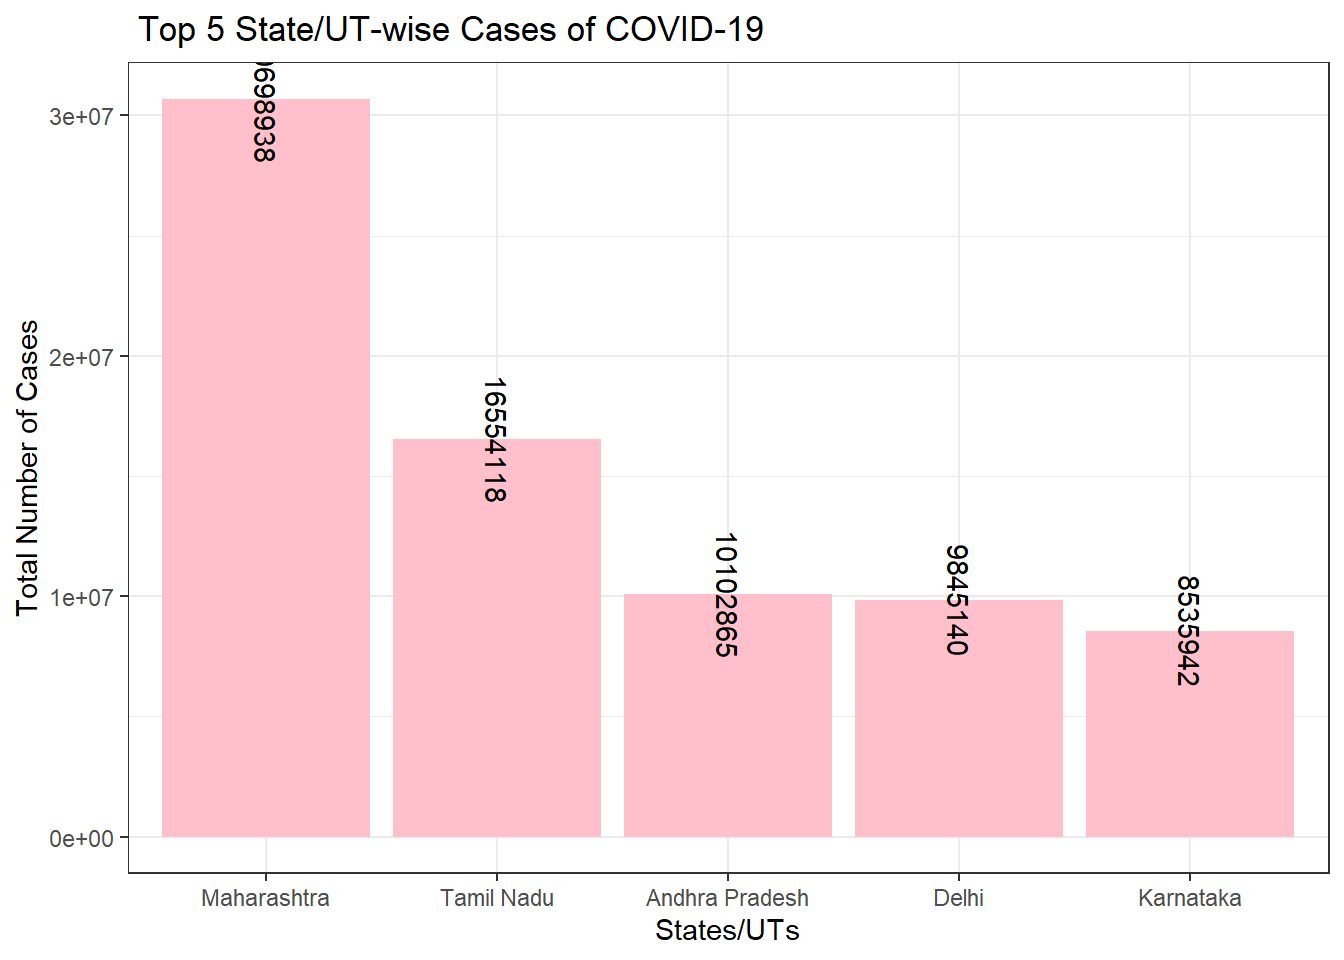
Figure 1: Bar plot for visualising the total cases in the states
The highlight of the analysis of this table is to look at the top 5 most affected states/territory within the country:
Maharashtra : 30698938 confirmed cases, with a population of 112374333
Tamil Nadu : 16554118 confirmed cases, with a population of 72147030
Andhra Pradesh : 10102865 confirmed cases, with a population of 49577103
Delhi : 9845140 confirmed cases, with a population of 16787941
Karnataka : 8535942 confirmed cases, with a population of 61095297
This can also be observed in the figure 1 for better visualization.
| Andhra Pradesh (N=15) | Delhi (N=20) | Karnataka (N=19) | Maharashtra (N=16) | Tamil Nadu (N=32) | Total (N=102) | p value | |
|---|---|---|---|---|---|---|---|
| Date | 0.003 | ||||||
| - Median | 2020-04-20 | 2020-04-10 | 2020-04-06 | 2020-04-13 | 2020-05-25 | 2020-04-20 | |
| - Range | 2020-03-14 - 2020-05-23 | 2020-03-03 - 2020-05-21 | 2020-03-09 - 2020-05-24 | 2020-03-12 - 2020-05-23 | 2020-03-07 - 2020-06-10 | 2020-03-03 - 2020-06-10 | |
| Cured | < 0.001 | ||||||
| - Mean (SD) | 408.400 (587.763) | 794.600 (1393.547) | 136.421 (202.675) | 2059.000 (3580.840) | 7344.781 (6762.506) | 2868.500 (5095.893) | |
| - Range | 0.000 - 1763.000 | 0.000 - 5192.000 | 0.000 - 608.000 | 0.000 - 12583.000 | 0.000 - 18325.000 | 0.000 - 18325.000 | |
| Deaths | < 0.001 | ||||||
| - Mean (SD) | 21.200 (20.595) | 36.050 (47.376) | 11.895 (14.008) | 355.812 (482.966) | 110.938 (100.019) | 103.020 (227.632) | |
| - Range | 0.000 - 55.000 | 0.000 - 176.000 | 0.000 - 42.000 | 0.000 - 1517.000 | 0.000 - 307.000 | 0.000 - 1517.000 | |
| Confirmed | < 0.001 | ||||||
| - Mean (SD) | 976.667 (960.458) | 2393.650 (3300.069) | 396.316 (515.821) | 9363.500 (13743.809) | 13984.469 (12167.330) | 6542.863 (10470.904) | |
| - Range | 1.000 - 2709.000 | 1.000 - 11088.000 | 1.000 - 1959.000 | 11.000 - 44582.000 | 1.000 - 34914.000 | 1.000 - 44582.000 |
Having done the datatable which shows the top 5 states/territories that have been adversely affected by the virus as our examples, we can further analyse the summary statistics for those states(Mean, Range, etc) which helps us understand the rate of infection, this can be produced by using the arsenal package in r for creating descriptive summary statistics.
The table 1 shows the relation of the state/territory with the other variables like death, recovered and ofcourse, the timeline of number of cases recorded.
What does the arsenal table depict?
Well the answer is pretty simple, for every state in the table, the factors are calculated for a p-value which helps in prediction of data, here in our case the case that whether these factors(death,cure,date,etc) affect the number of total confirmed cases within the state and hence the overall country. Looking at the last column within our table 1, we see a p-value of either 0.003 or 0 which is a value very less than the significance level (0.05), which means that the values death, cured, date and confirmed cases are factors of change for the rate of infection within each state.
The means and ranges for each of the factors against the states have also been calculated.
There are certain dates within the cumulative dates that are very significant and stand out for the our analysis.
The means for cured depict the state that had a very high average rate of recovery, which according to the table is Tamil Nadu followed by Maharashtra .
The means for Deaths depict the average deaths within each state and the highest rate of deaths according to the table is in Maharashtra.
The means for Confirmed Cases within each state depict the cases with positive test results with Maharashtra at the top which matches our analysis with the datatable from above.
From the above analysis, we can conclude by saying that the overall situation of the country is not good, with cases increasing everyday and a population so high, precautions are a must. The state with the highest number of recorded cases and deaths with very low recovery rate in accordance to the infection rate is Maharashtra.
I know it is a scary time but we need to take all the necessary precautions for ourselves and our loved ones. Stay Safe!
References
How to Easily Create Descriptive Summary Statistics Tables in R Studio - By Group. Thatdatatho.com. (2020). Retrieved 3 September 2020, from http://thatdatatho.com/2018/08/20/easily-create-descriptive-summary-statistic-tables-r-studio/.
Covid:19 India Data Analysis and Forecasting. Kaggle.com. (2020). Retrieved 3 September 2020, from https://www.kaggle.com/anujgupta872003/covid-19-india-data-analysis-and-forecasting.
Corona Stay Home GIF by INTO ACTION - Find & Share on GIPHY. GIPHY. (2020). Retrieved 3 September 2020, from https://giphy.com/gifs/IntoAction-chart-stay-home-stayhome-Qu1fT51CG14ksIkASL.
Yihui Xie, Alison Presmanes Hill, and Amber Thomas (2017). blogdown: Creating Websites with R Markdown. Chapman and Hall/CRC. ISBN 978-0815363729
Wickham et al., (2019). Welcome to the tidyverse. Journal of Open Source Software, 4(43), 1686, https://doi.org/10.21105/joss.01686
Ethan Heinzen, Jason Sinnwell, Elizabeth Atkinson, Tina Gunderson and Gregory Dougherty (2020). arsenal: An Arsenal of ‘R’ Functions for Large-Scale Statistical Summaries. R package version 3.5.0. https://CRAN.R-project.org/package=arsenal
Yihui Xie, Joe Cheng and Xianying Tan (2020). DT: A Wrapper of the JavaScript Library ‘DataTables’. R package version 0.15. https://CRAN.R-project.org/package=DT
Varsha Ujjinni Vijay Kumar
Student
A Business Analytics student trying to get data and work with it and learn.